Introduction
This is the third and last of a series of posts on card counting in blackjack. In Part 1, we started with the simplest reasonable “basic” playing strategy, in which decisions to stand, hit, double down, etc., are based solely on the player’s current hand total and the dealer’s up card. (For example, always hit hard 16 against a dealer ten.) Yet even using this fixed playing strategy, a player’s expected return can vary significantly from round to round, since the dealer deals multiple rounds from the same shoe before reshuffling.
In Part 2, we described how to estimate this varying expected return using the true count, calculated– in your head, at the table– as a linear combination of the probabilities of card ranks remaining in the current depleted shoe. The true count dictates betting strategy, betting more on rounds estimated to have a favorable advantage for the player.
But we can also use the true count to vary playing strategy. My objective in this post is two-fold. First, I will describe the best possible playing strategy, and the maximum gain in expected return that can possibly be achieved by employing such a strategy. Second, I will describe the more realistic indexed playing strategies that use a true count, and measure their efficiency, i.e., how close they come to realizing that best possible gain in expected return.
The perfect card counter
What does “perfect play” mean? In the context of this discussion, I mean the playing strategy that maximizes the expected return for each round, assuming perfect knowledge of the distribution of card ranks remaining in each corresponding depleted shoe. In other words, what if you could bring a laptop with you to the table?
Prior to each round, there are two interesting expected values to consider, that are essentially the endpoints of the spectrum of possible performance by a blackjack player. First, at the low end, there is the expected value assuming that the player uses fixed, total-dependent basic strategy (as described in Part 1). At the high end, there is the expected value
assuming that the player instead plays perfectly, assuming knowledge of exactly how many cards of each rank remain in the current shoe.
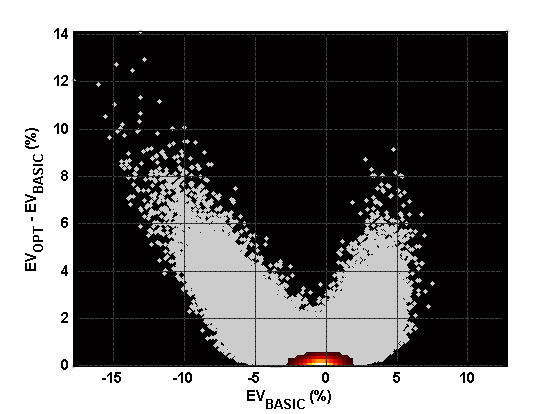
The following figure shows the difference between these two. That is, how much can the basic strategy player possibly expect to gain by varying playing strategy? Each gray point represents one simulated round of play. The x-coordinate of each point indicates the corresponding ; the y-coordinate indicates
. As before, the scatterplot is overlaid with a smoothed histogram to indicate the greater density of points near the origin.

Expected gain from using optimal strategy, vs. expected return from fixed, total-dependent basic strategy.
What is the overall per-round expected return for these two “endpoint” strategies? The basic strategy player’s expected return is about -0.4239% (note that this value is less than the “full-shoe” expected return quoted in Part 1 due to the cut card effect), while perfect play yields an expected return of only -0.2333%. In other words, even equipped with a laptop at the table, the house still has an advantage! This is not as surprising as it sounds; since we are focusing on playing efficiency, we are assuming flat betting. This merely emphasizes the point that, in shoe games, accurate betting strategy is more important than varying playing strategy.
The figure above essentially shows the “distance” between a basic strategy player and a perfect player. The performance of any actual card counting system, no matter how simple or complex, will lie somewhere in between these two extremes. If we define the playing efficiency of basic strategy to be zero, and the playing efficiency of perfect play to be one, then the efficiency of any other strategy is calculated using its per-round expected return
according to
It now remains only to compute this expected return for some actual card counting strategies of interest, and evaluate their corresponding efficiencies.
(A word of caution: before anyone runs off quoting this as “the” formula for playing efficiency, note that these particular constants depend on all of the rule variations, number of decks, and penetration assumed at the outset of this discussion.)
True count indices
The latest additions to my blackjack analysis software allow exact evaluation of indexed playing strategies that vary based on the true count. For example, the most common refinement of basic playing strategy is to hit hard 16 against a dealer ten… unless the true count is zero or greater, in which case you should stand. A more complex example is soft 18 vs. dealer 2. Basic strategy in this situation is to stand, but a more complex index strategy is to hit if the true count is less than -17, stand if it’s less than 1 (but at least -17), otherwise double down.
More generally, we can specify an arbitrarily complex indexed playing strategy as a list of “exceptions” to total-dependent basic strategy. Each exception is identified by a tuple , where
is the player’s hand total, with a negative value indicating a soft hand.
is the dealer’s up card.
is 1 if the player is allowed to double down on the hand, otherwise 0.
is 1 if the player is allowed to split the pair hand, otherwise 0.
is 1 if the player is allowed to surrender the hand, otherwise 0.
For each of these situations, the indexed playing strategy is given by a partition of the real line into half-open intervals of possible true counts, where each interval corresponds to a particular playing decision, encoded as 1=stand, 2=hit, 3=double down, 4=split, or 5=surrender.
For example, following are the so-called “Illustrious 18” index plays using the Hi-Lo true count. Compare this machine-readable format with the original list generated by Cacarulo at bjmath.com. Note how the playing decisions are interleaved with the true count indices indicating the endpoints of the corresponding intervals, with +1000 acting as “positive infinity.”
# Hi-Lo Illustrious 18 Revisited (Cacarulo)
# cnt up  dbl spl sur p1 tc1 p2 ... +1000
  +16 10   0   0   0  2   0  1      +1000
  +16 10   1   0   0  2   0  1      +1000
  +12  3   0   0   0  2  +2  1      +1000
  +12  3   1   0   0  2  +2  1      +1000
  +15 10   0   0   0  2  +4  1      +1000
  +15 10   1   0   0  2  +4  1      +1000
  +11  1   1   0   0  2  +1  3      +1000
  +12  2   0   0   0  2  +3  1      +1000
  +12  2   1   0   0  2  +3  1      +1000
   +9  2   1   0   0  2  +1  3      +1000
  +20  5   0   1   0  1  +5  4      +1000
  +20  5   1   1   0  1  +5  4      +1000
  +20  6   0   1   0  1  +4  4      +1000
  +20  6   1   1   0  1  +4  4      +1000
   +8  6   1   0   0  2  +2  3      +1000
  +16  9   0   0   0  2  +4  1      +1000
  +16  9   1   0   0  2  +4  1      +1000
  -19  6   1   0   0  1  +1  3      +1000
  +12  4   0   0   0  2   0  1      +1000
  +12  4   1   0   0  2   0  1      +1000
  -19  5   1   0   0  1  +1  3      +1000
  +13  2   0   0   0  2  -1  1      +1000
  +13  2   1   0   0  2  -1  1      +1000
  +10  1   1   0   0  2  +3  3      +1000
  +10  1   1   1   0  2  +3  3      +1000
   +8  5   1   0   0  2  +4  3      +1000
   +9  7   1   0   0  2  +3  3      +1000
In addition to the Hi-Lo Illustrious 18, I also generated full sets of indices for the Hi-Lo and Hi-Opt II counts, using CVIndex, part of the Casino Vérité suite of blackjack analysis software.
The new analysis capability that I am excited about– that motivated this series of posts– is the ability to quickly compute the exact expected return for any given subset of cards in a depleted shoe, using an indexed playing strategy as specified above.
Efficiency results
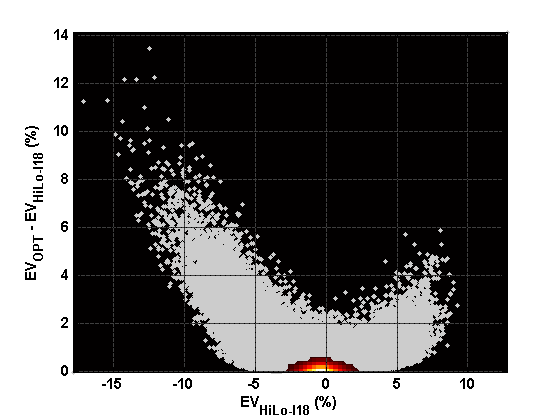
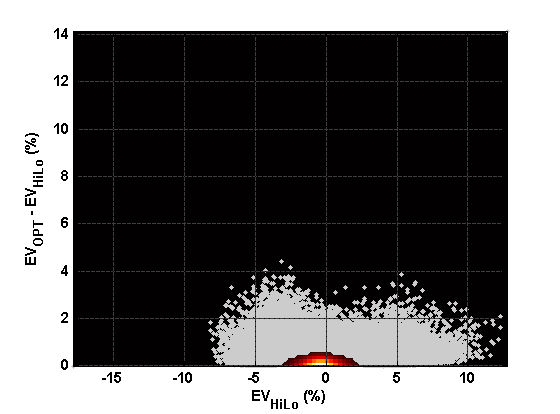
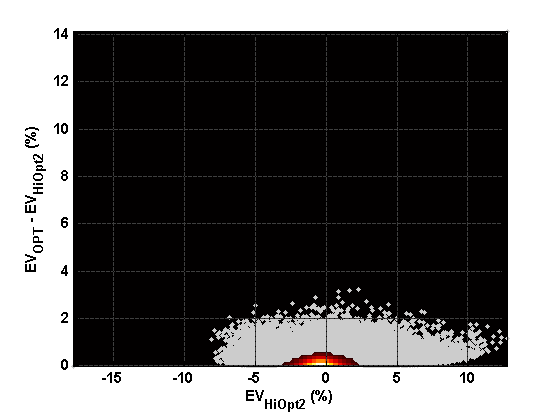
The following figures show the distribution of gain in expected return, similar to the figure above, for three different and progressively more complex card counting systems:
- Hi-Lo Illustrious 18 (as revised by Cacarulo)
- Hi-Lo with full indices
- Hi-Opt II with full indices
For easier comparison of improvement in performance, each figure has the same axis limits as the “baseline” figure above.
Hi-Lo Illustrious 18 (revisited)
Hi-Lo full indices
Hi-Opt II full indices
Finally, we can compute the corresponding playing efficiencies:
- Hi-Lo Illustrious 18 has playing efficiency PE = 0.309.
- Hi-Lo with full indices has PE = 0.470.
- Hi-Opt II with full indices has PE = 0.639.
I think this analysis raises as many questions as it answers. For example, these more accurate calculations of playing efficiency are lower than the approximations given by Griffin (see Chapter 4 in the reference below). There are several possible reasons for the difference: is the approximation inherently biased, or is it simply due to different assumed number of decks, penetration, etc.?
References:
1. Griffin, Peter A., The Theory of Blackjack, 6th ed. Las Vegas: Huntington Press, 1999.


I find it very difficult to count cards in blackjack. I guess it’s not within the reach of everyone.
Pingback: Distribution and variance in blackjack | Possibly Wrong
Thanx muchly,
especially for the extraordinary results re: Hi-Opt II
I play double deck BJ and Side Count Aces and Sevens
for PLAYING DECISIONS. I am wondering just how much
higher my P. E. is than the 0.639 that you presented.
Can you clarify this for me ?
Pingback: Risk of (gambler’s) ruin | Possibly Wrong
Try posting this to https://www.reddit.com/r/math/ or https://www.reddit.com/r/askmath/ . I dunno how accurate your playing efficiency is but PE(v) = \frac{v + 0.004239}{0.001906} + correlation coefficient per true count seems to matter on each rule set per bj tables then?
If I understand your question, then yes; note the comment in the post: “A word of caution: before anyone runs off quoting this as “the” formula for playing efficiency, note that these particular constants depend on all of the rule variations, number of decks, and penetration assumed at the outset of this discussion.” That is, if you instead want to evaluate playing efficiency in, say, a single-deck game, then those endpoint EVs– and thus the constants 0.004239 and 0.001906– will change. Change the rules for another single-deck game, and the constants must change again, etc.
Lovely article and a littke about yourself please?
How did you cone to the figure of -0.001906 from -0.2333%.
The scattergram images are showing the effects of flat bet strategy? If so a spread of x12 at TC5 will have an even greater effect from index plays?
@Jim (I think the following addresses your email question as well): to see where the proposed playing efficiency formula comes from, let a=-0.004239 be the fixed total-dependent basic strategy per-round expected return, and b=-0.002333 be the optimal (CDZ-) strategy expected return; these are the “endpoints” of reasonable *playing* performance (with flat betting). Then the short answer is that the +0.001906 value is b-a. That is, given the per-round expected return v for any other playing strategy– where v lies somewhere between the extremes a and b– the playing efficiency is (v-a)/(b-a), i.e., we *define* the PE of fixed total-dependent basic strategy to be zero, and we *define* the PE of “perfect play” to be 1.0, with the PE of any intermediate strategy being the “fraction of best possible gain in EV” that the intermediate strategy buys us.
And as pointed out in the article, these particular values of a and b, and the computation of any intermediate values v, all depend on the particular game being studied: the number of decks, rule variations, penetration, etc.
Also, as you point out, everything presented here focuses on playing (vs. betting) strategy, essentially assuming flat betting throughout. To evaluate the effect of betting strategy, we need to be able to efficiently (and still *exactly*) compute not just the expected return, but the entire probability distribution (or at least the variance) of outcomes of a round. This required some significant new algorithm development, which is described in another later series of posts here, here, and the punch line with win rates and RoRs for various index strategies here.